A Rowing Contact Mechanics Evaluation

01 / THE BOATS & THE QUESTION

Moving seat.
Moving row box.

This study evaluates how two sculling boat configurations support a rower’s leg drive: a moving seat with fixed oarlocks, and a fixed seat with a moving row box.

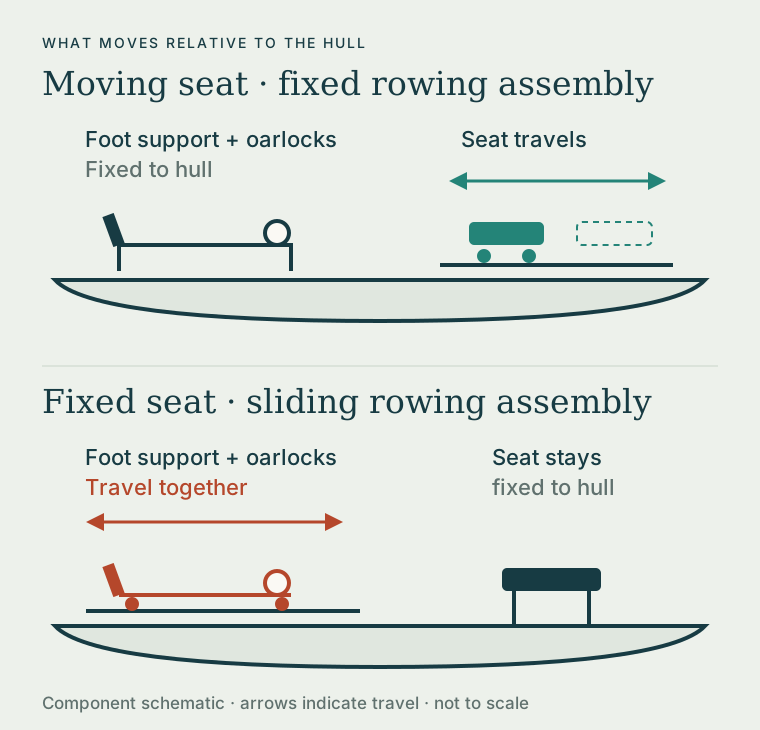
In sculling, each rower handles two oars, one in each hand. [10] Both configurations let the legs extend through the drive, but different parts move relative to the boat’s hull.

Moving seat
The seat rolls along tracks. The foot support and oarlocks stay fixed to the hull.
Fixed seat / moving row box
The seat stays fixed. The foot support and oarlocks travel together on a linked carriage, called the row box here. This is also known as a sliding-rigger configuration.

The fixed-seat design evaluated here retains a moving foot support and a full leg drive. Traditional fixed-seat boats with fixed feet and oarlocks are outside this study.

Moving-seat boat: the seat travels while feet and oarlocks remain fixed to the hull. Fixed-seat boat: the linked row box carries the feet and oarlocks along the hull.
Two ways to accommodate leg extension. “Fixed” and “moving” describe each component’s position relative to the hull.

WHY TWO DESIGNS?

Two answers to the same need for leg drive.

Early racing boats used fixed seats. During the nineteenth century, racing crews adopted sliding seats to lengthen the stroke and make fuller use of the legs. The Oxford–Cambridge Boat Race first used sliding seats in 1873. [11]

The alternative is nearly as old: Michael F. Davis’s 1878 patent described a fixed seat with moving foot support and outriggers. [12] Moving the row box retains leg drive while reducing the amount of body mass traveling along the hull. Reducing the associated surging and pitching is a design motivation. [13] Both designs accommodate the stroke, but they place different demands on the seat’s support and grip.
LAKE UNION, SEATTLE / SUMMER 2026

The observation behind this study.

I undertook this study to see whether contact mechanics could explain and corroborate that experience. Could the force needed to keep me on the fixed seat exceed its available grip, limiting how hard I could drive?

The evaluation compares the seat loads in the two configurations and tests when sliding occurs in simplified models.

BOTTOM LINE UP FRONT

The fixed-seat example
predicts sliding.

The hypothesis

The slipping experienced on Lake Union may reflect a contact limit: a strong drive in a fixed-seat, moving-row-box boat can require more grip than the seat provides, making familiar power levels harder to apply.

The illustrative result

The fixed-seat snapshot needs about 157 N of horizontal support against 124 N of available grip. Its drive-pulse model slips. A separate moving-seat example needs about 15 N and remains within its grip limit.

What this establishes

The models demonstrate a possible seat-slip mechanism. They use assumed inputs and different hull-motion conditions. They do not establish a real rower’s power loss or a matched performance difference between boats.

Study type: independent computational mechanics study · illustrative parameters · version 2, 13 October 2026. Study status and methods ↗

02 / THE PROPOSED MECHANISM

Required force.
Available grip.

Sliding starts when the horizontal force needed at the seat exceeds the grip available from friction and the downward seat load.

A moving seat

Seat contact accelerates the lightweight seat and overcomes rail resistance. In this example, the rail moves at constant hull speed.

A fixed seat

Under the assumed sliding-rigger load path, seat contact transfers force to the hull. That hull accelerates and encounters drag. Longitudinal force through the rigger bearings is assumed negligible.

Both rowing examples use the same static and sliding friction coefficients: 0.35 and 0.28. Their hull-motion assumptions differ.

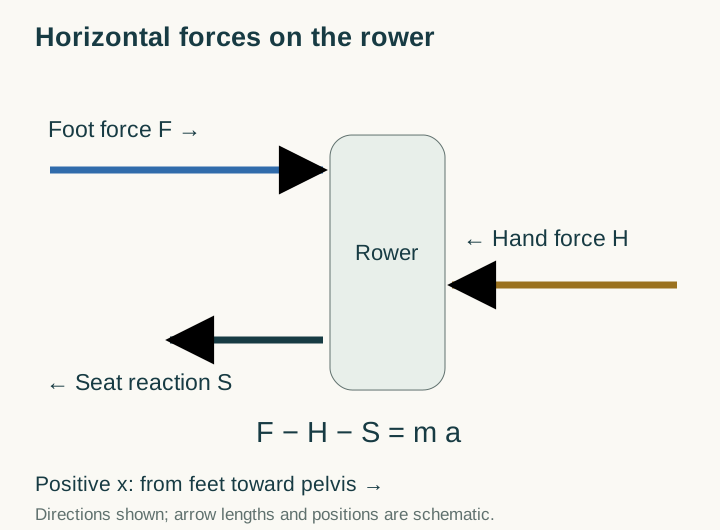
Horizontal force balance on the rower: foot force F acts from feet toward pelvis; hand force H and seat restraint S oppose it; F minus H minus S equals mass times rower acceleration.
A translation diagram. Vertically, the assumed seat normal load is body weight minus prescribed unloading. Body rotation and vertical acceleration are suppressed in the drive models.

NARRATED MODEL COMPARISON / 45 SECONDS

See the contact mechanism.

Follow the configurations, compare the assumed seat loads, and see how grip changes the outcome of a fixed-seat drive-force pulse.

The rowing figures illustrate component motion. The force and slip displays use the numerical models. Seat-relative displacement means sliding, not cushion compression.
Read the narration transcript

Two configurations

Does a fixed seat need more grip during a strong drive? Here, the seat moves. Here, the feet and oarlocks move together.

Illustrative seat loads

In these simplified examples, the moving seat needs about fifteen newtons of horizontal support. The fixed seat needs a hundred and fifty-seven, against a hundred and twenty-four available. Their hull-motion assumptions differ.

A prescribed drive pulse

The fixed-seat drive model starts slipping at about point three seconds. It reaches the chosen hundred-and-twenty-millimeter boundary at point six one seconds.

Grip changes the outcome

More grip prevents slip in the same fixed-seat model. The result depends on the assumptions. These calculations demonstrate a possible contact limit. They do not measure a difference in rowing power.

Download the MP4 ↓Animation methods ↗

03 / ILLUSTRATIVE RESULTS

Two local seat-load examples.

The same prescribed foot force, hand force, and vertical seat load are applied to two simplified systems. The calculation compares their local contact demands.

Assumed snapshot: foot force 1,200 N · opposing hand force 780 N · seat normal load about 354 N · static friction coefficient 0.35. These inputs were not measured from a rower or boat.

MOVING SEAT · CONSTANT-SPEED HULL

About 15 N required

A 2 kg seat and 5 N rail resistance give a demand below the available 124 N of grip.

The moving-seat pulse remains within its grip limit.

FIXED SEAT · ACCELERATING HULL

About 157 N required

An 85 kg rower, 25 kg hull, and fixed snapshot drag of 80 N give a demand above the available 124 N of grip.

This is the reaction needed to remain stuck, not the actual friction after sliding.

Different hull-motion assumptions make these examples a comparison of contact mechanisms. They do not isolate a whole-boat effect of seat configuration, and their force ratio is not a power or efficiency ratio. Force balances and input table ↗

In the fixed-seat drive pulse, grip changes the result.

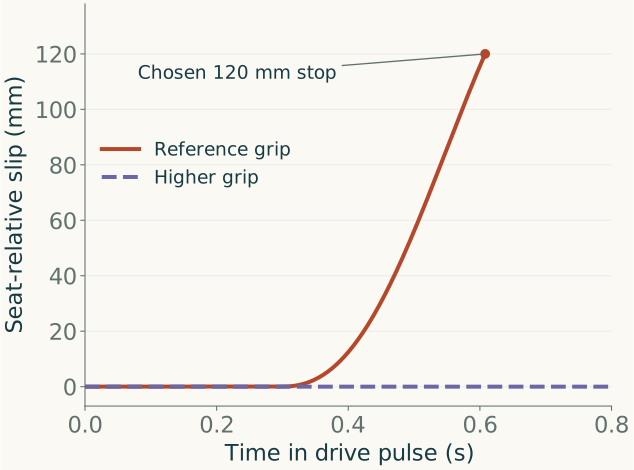
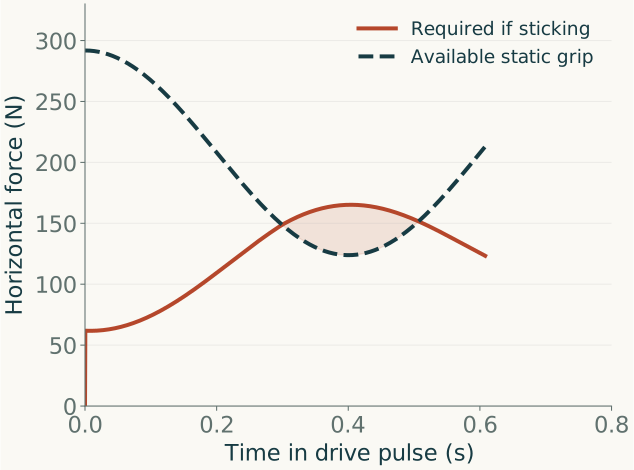
The reference case begins slipping at about 0.30 s and reaches the chosen 120 mm travel boundary at about 0.61 s. With higher friction, the same prescribed drive remains supported. The drive model updates drag as the hull speed changes, so its force demand differs from the fixed-drag snapshot above.

Reference fixed-seat drive pulse: required sticking force rises above available static grip near 0.30 seconds. The trace ends at the chosen slip boundary.
Demand crosses capacity. Shading marks where required sticking force exceeds available grip. After slip begins, actual friction uses the lower sliding coefficient. Existing relative motion can persist as the load falls.
Reference fixed-seat slip rises to 120 millimeters near 0.61 seconds. The higher-grip fixed-seat case remains at zero slip throughout the 0.8-second prescribed drive pulse.
A fixed-seat counterexample. Reference friction: 0.35 static / 0.28 sliding. Higher grip: 0.60 / 0.50. All other drive-model inputs are unchanged. The 120 mm stop is chosen, not a measured seat edge.

These are drive-force pulses, not complete strokes with finish and recovery. The figures show model behavior, not measured athlete trajectories. Exact results and numerical refinement ↗

04 / EXPLORE THE ASSUMPTIONS

Find the contact margin.

Adjust foot force, grip, and unloading to see when a fixed seat on a floating hull can support the specified instantaneous load. The calculator shows how the study’s force balance responds to each assumption.

Instantaneous loading

Fixed inputs: rower 85 kg; hull 25 kg; drag 80 N; g = 9.81 m/s²; no relative center-of-mass acceleration. These illustrative inputs are not calibrated to a particular rower or boat.

FLOATING HULL / PEAK-STATE CHECKFriction exceeded
−33N of contact margin

The required seat traction exceeds the available static friction.

Required traction 157 N
Friction capacity 124 N
Seat normal force
354 N
Hull acceleration
3.09 m/s²
Required coefficient
0.444
Family force ceiling
1,048 N

This scalar test does not check pitching, tissue pressure, or an athlete’s available alternative strokes.

See the equations and moment-closure assumptions

ab = [(1 − κ)F − D] / (M + m)

S = D + Mab   ;   margin = μN − |S|

Fmax = [μmg − mD/(M+m)] / [M(1−κ)/(M+m) + μβ]

The last expression is the one-sided scalar bound with S ≥ 0. The calculator separately checks N > 0. A negative numerator means no admissible force in this nonnegative loading family. Displayed values are rounded; the equations use full precision.

This separate rigid-pose example assumes a horizontal hand force and places the upward force U at the feet. It fixes the center of pressure at the seat center. Foot position (−0.85, −0.10) m; hand height 0.30 m; center of mass (−0.05, 0.30) m. Vertical and angular accelerations are zero.

U = [−mzcab + zfF − zhκF + xcmg] / xf

N = mg − U

Changing the posture or allowing body motion changes this closure.

05 / INTERPRETATION & EVIDENCE

What the results establish.

A prescribed drive can exceed a fixed seat’s modeled grip. Increasing grip or reducing the applied force avoids that outcome in the same reduced model. The result depends on the chosen loading, contact properties, and motion assumptions.

Checked computationally

Force balances, known sliding solutions, energy accounting, and numerical refinement agree within the declared tolerances.

Demonstrated in the example

Required seat support can exceed available grip, allowing relative sliding during the assumed drive.

Not measured

Real seat properties, an athlete’s power loss, or a matched difference in whole-boat speed and efficiency.

Limits of the evidence ↗ · Power interpretation and related research ↗